In this post, we’ll look at how to create an awesome roadmap using Confluence’s road mapping planner macro. This roadmap will give your team visibility over their current and future work streams, dependencies on internal or external events and deep linking to the confluence pages documenting the individual projects in detail. Once you have read this post you’ll be on your way to dominating the road-mapping game :).
Let’s have a look at what we’re going to build.
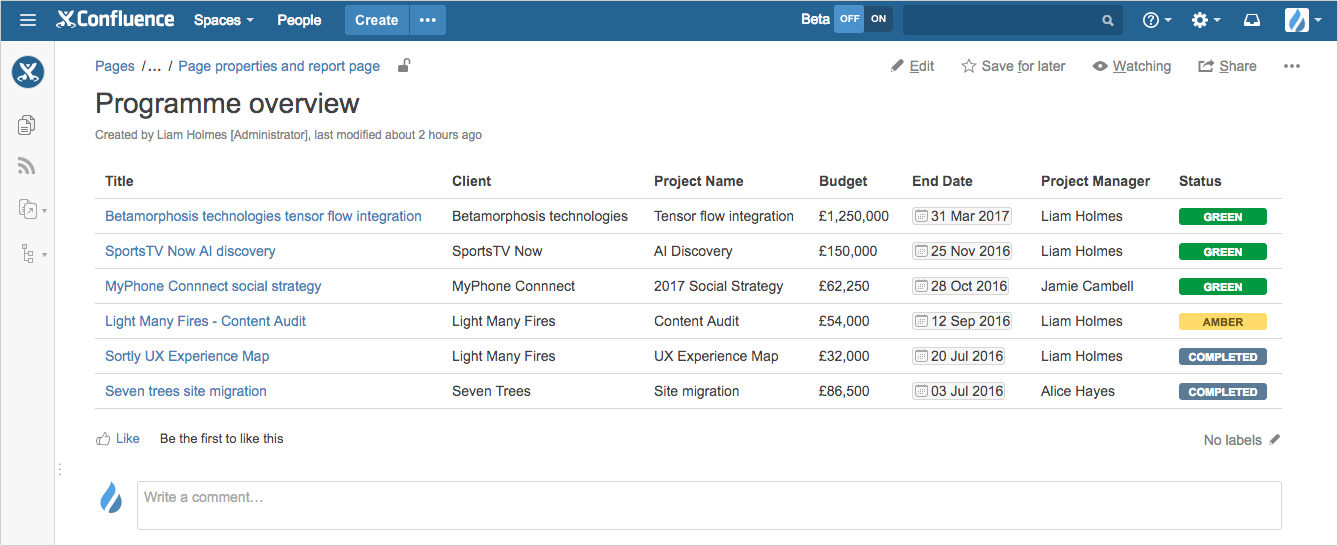
In the last the post we looked at how to create a summary page for a programme of work using the page properties and pages properties report macros.
Below is an image of the summary page that was created.
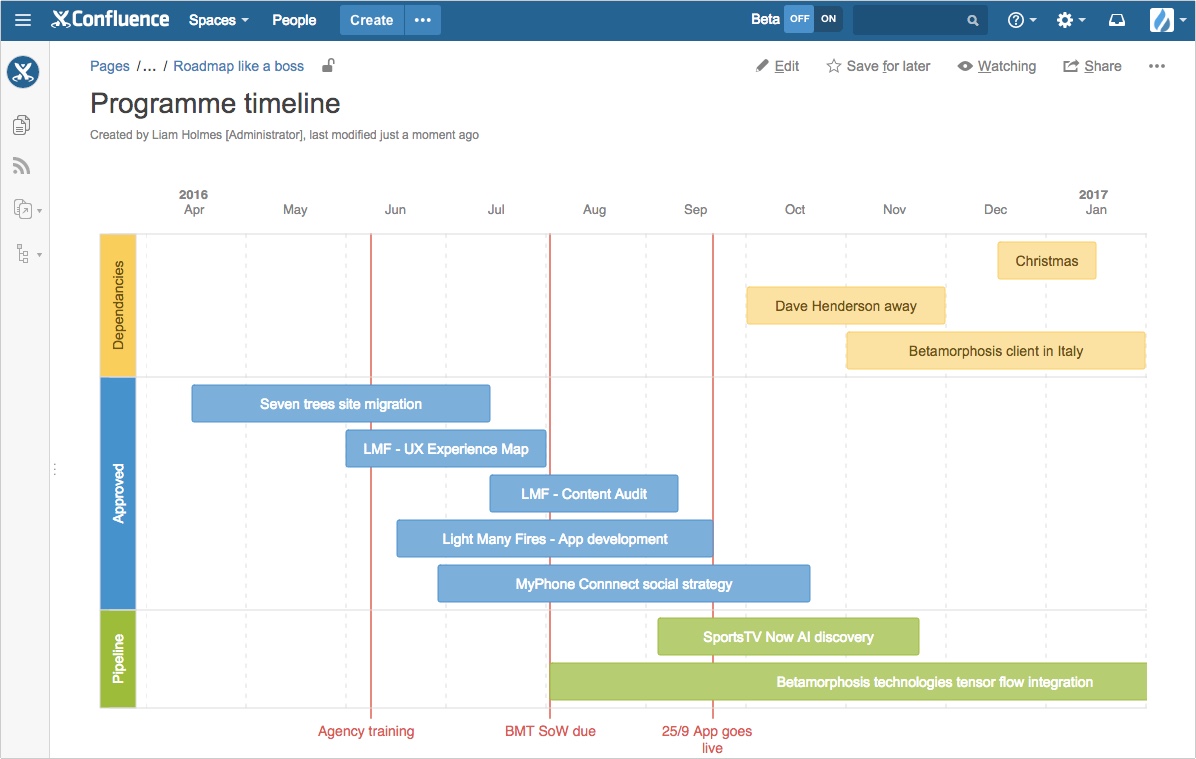
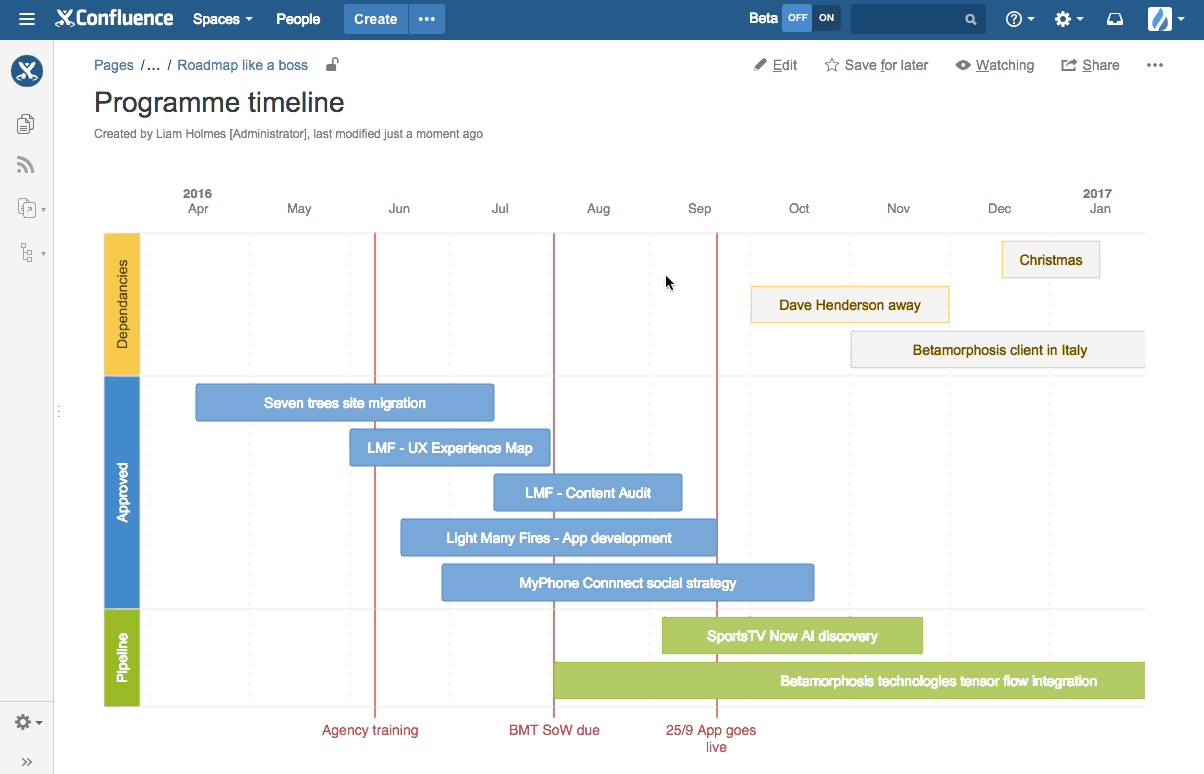
In this post we’re going to create a visual roadmap for this programme of work and here’s what it’s going to look like. Pretty sweet hey!
Ok, let’s get going!
Create a new page and call it ‘Programme timeline’ then from the macro dropdown select ‘other macros’.
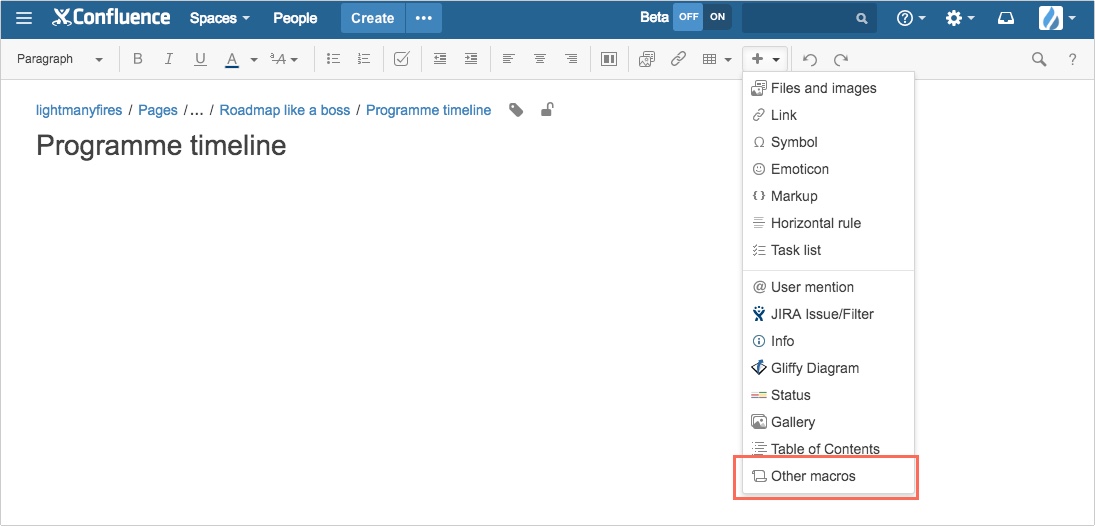
In macro modal screen, search for ‘roadmap planner’ macro then select it.
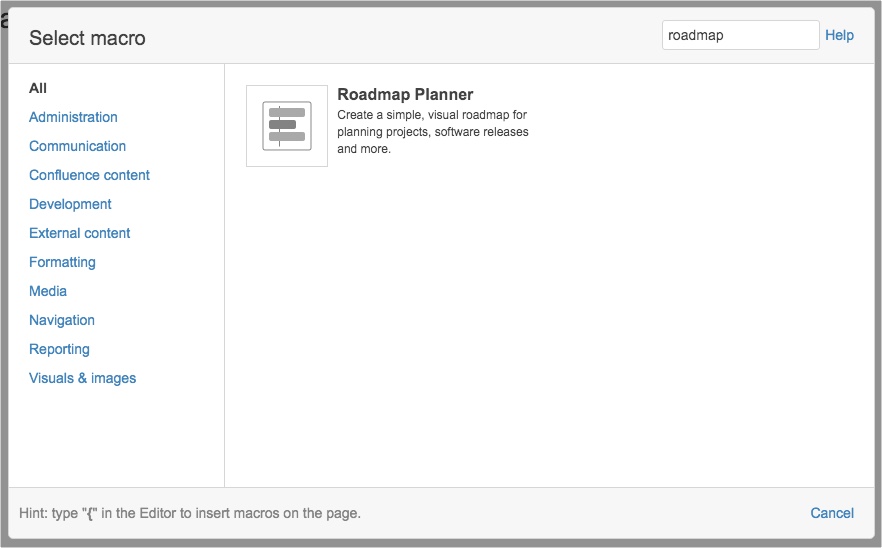
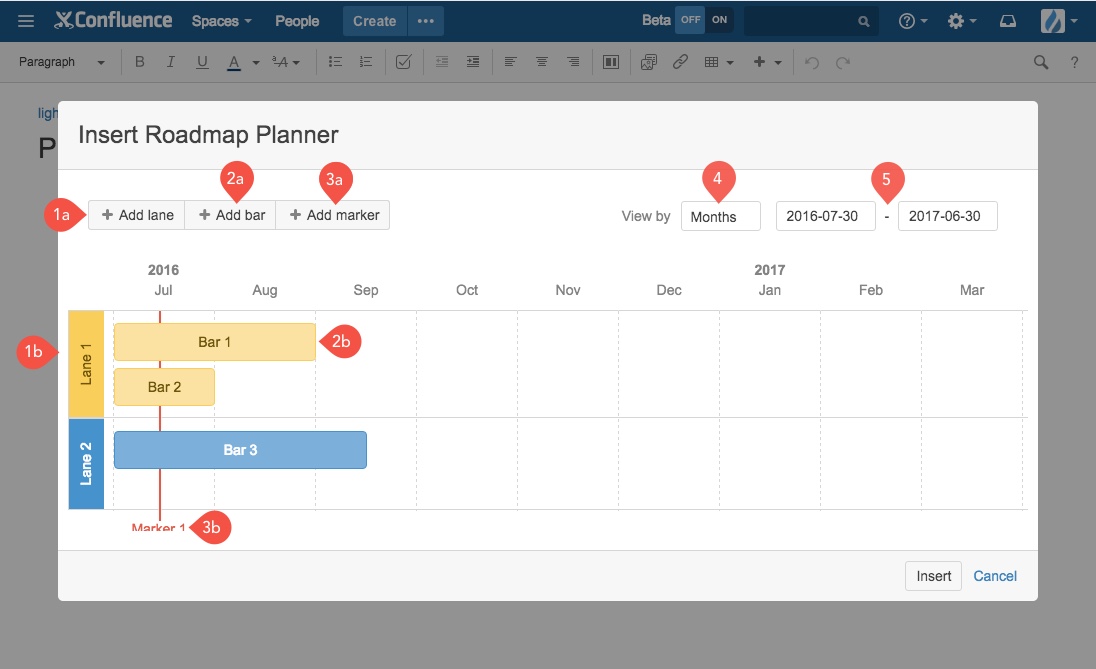
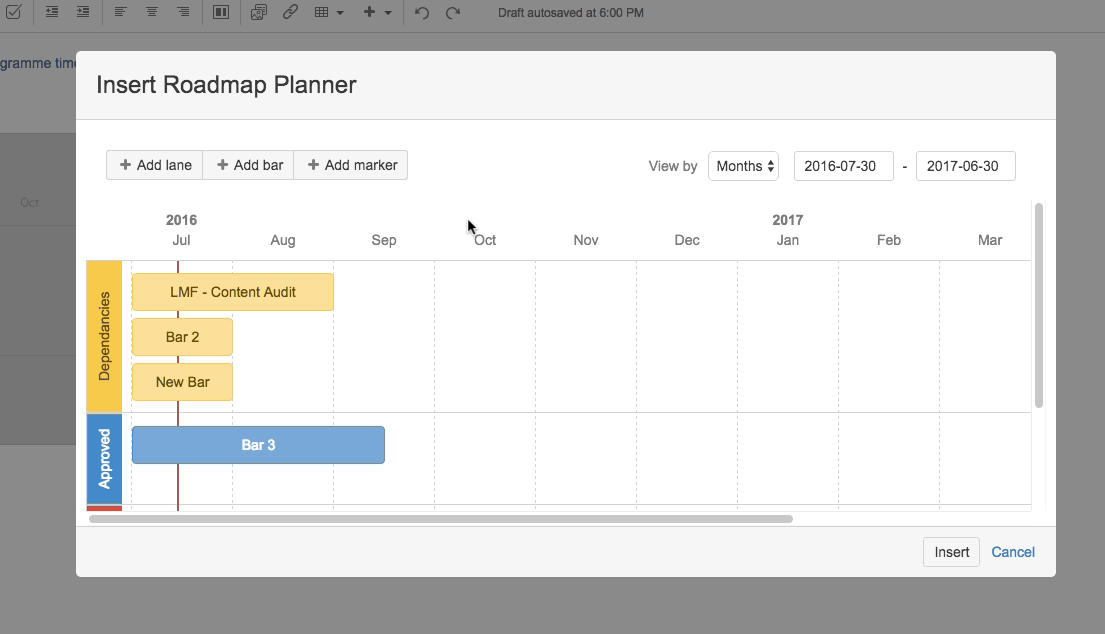
You will now see the default view of the Roadmap planner macro for you to edit.
Within this view you’ll be able to:
- Add a lane to break up the view into discrete swim lanes
- Add new bars which you can then drag across and into the swim lanes.
- Create markers to display key milestones or dates.
- Toggle between weeks or months in which your roadmap will be displayed.
- Set the displayed start and end date of the roadmap.
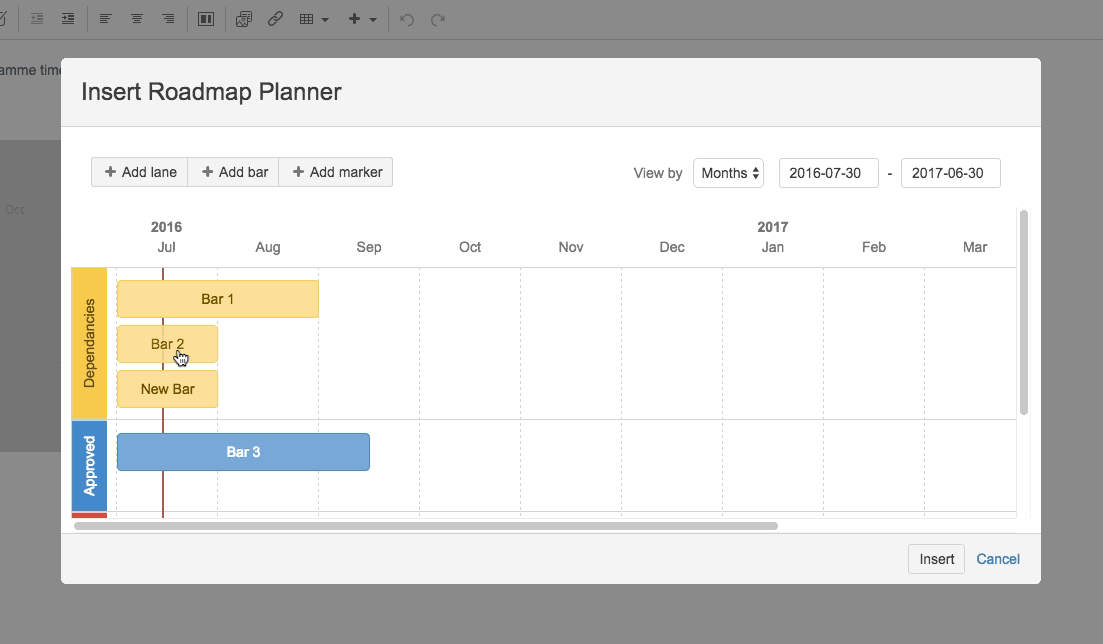
When you’re in the edit view of the roadmap macro it is super simple to move the bars around. With a click and drag gesture of your mouse or trackpad you can drag the bars up and down the timeline, drag the bars into other swim lanes, and modify the bars duration by dragging out their start and end dates.
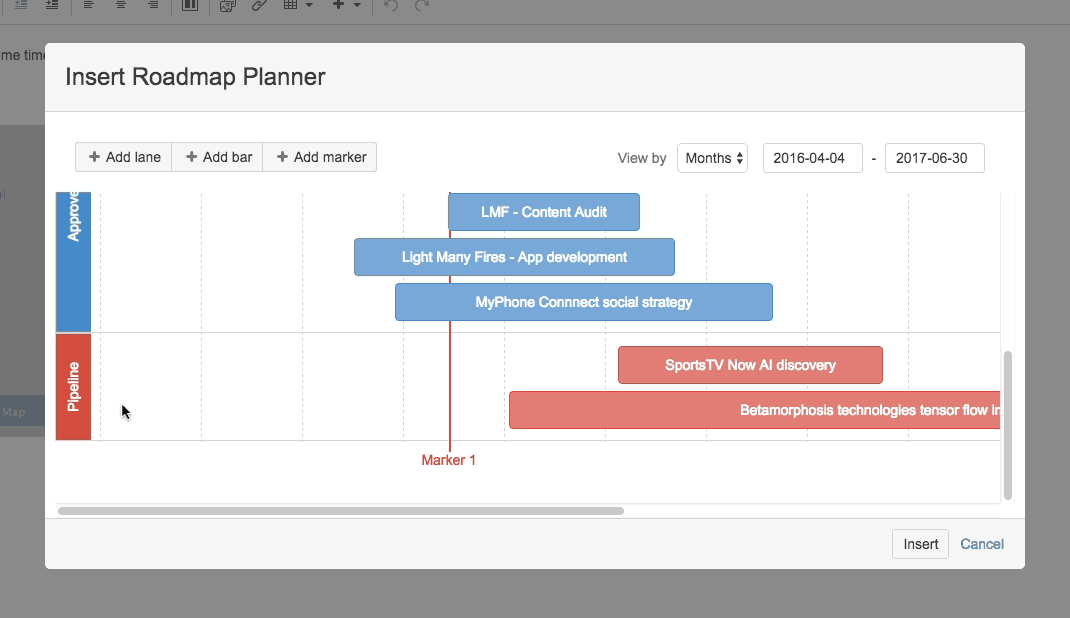
In our example we are going to create 3 swim lanes:
- “Approved” for all projects that have been approved by the client.
- “Pipeline” projects that are likely to happen but yet to be formalised approved by the client.
- “Dependencies” to display key periods that the team need to be aware of, such as client holidays or events such as Christmas.
First up, let’s give the bars a name.
Go back into edit mode of the page and double click on the macro to edit it. Click on a bar and you’ll see the pop-over allowing you to name the bar.
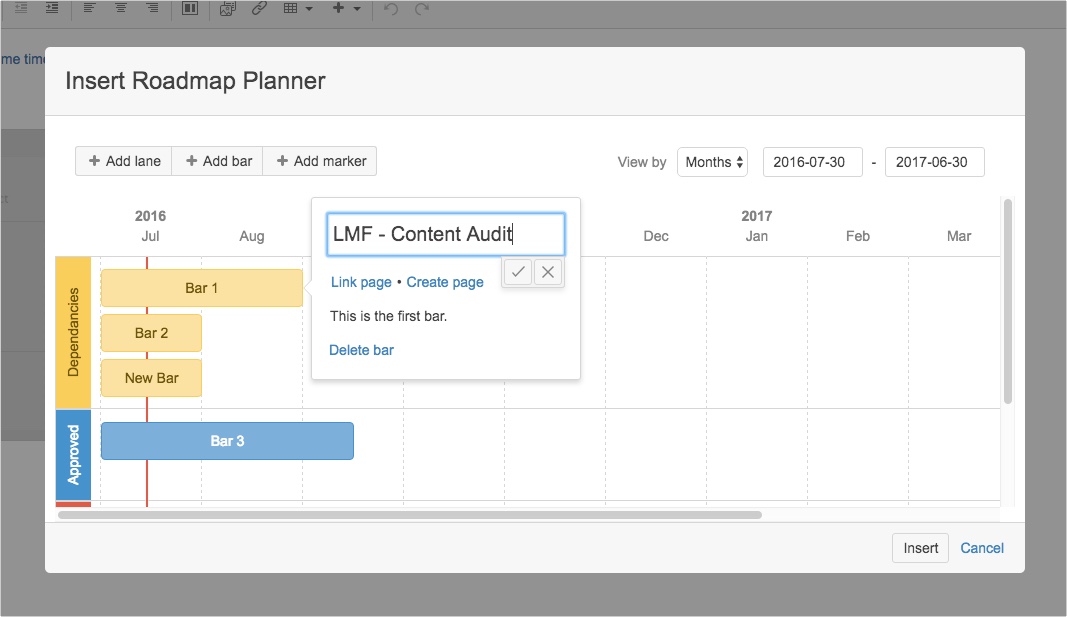
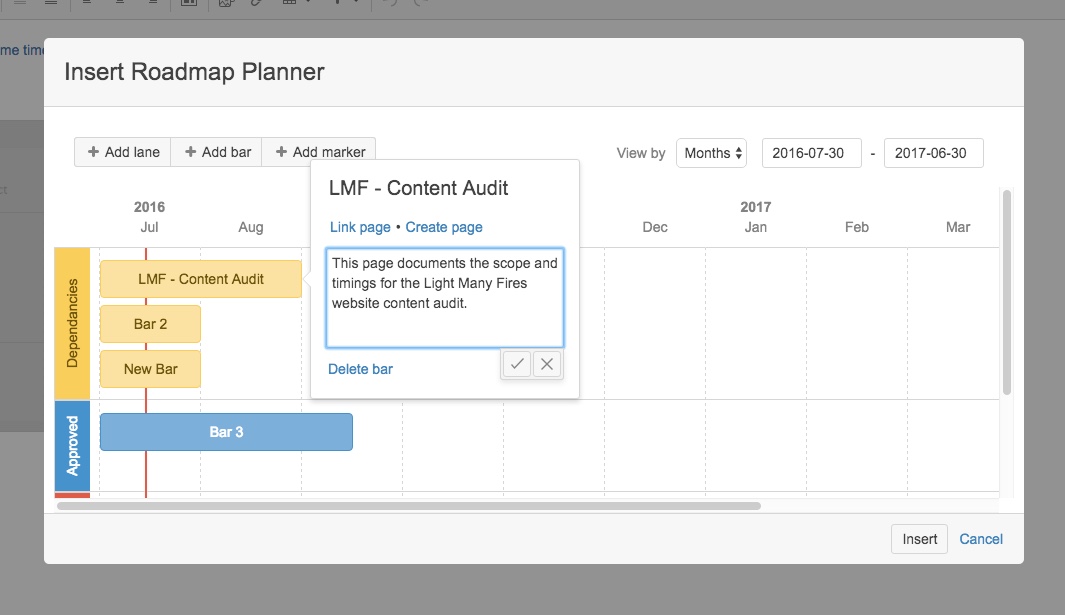
Similarly, you can give the give the bar a description. This is a really useful feature, especially when your team just want a quick overview of what the bar represents, but don’t want to jump into the project documentation.
Now link up the bars to project documentation or other Confluence pages by linking to existing pages, or create new pages directly from this pop-up.
I am going to add a name, description and link to the project page for each of the projects in our programme. I will then add those project bars to the appropriate swim lane. But before I do, let’s see how we change the colour of a swim lane and its associated bars. Go into edit mode of the macro, click on the header for the given swim lane. You will then see a popover that will allow you to change the colour of the swim lane and it’s associated bars as seen below.
Let’s save the page to see what it’s looking like.
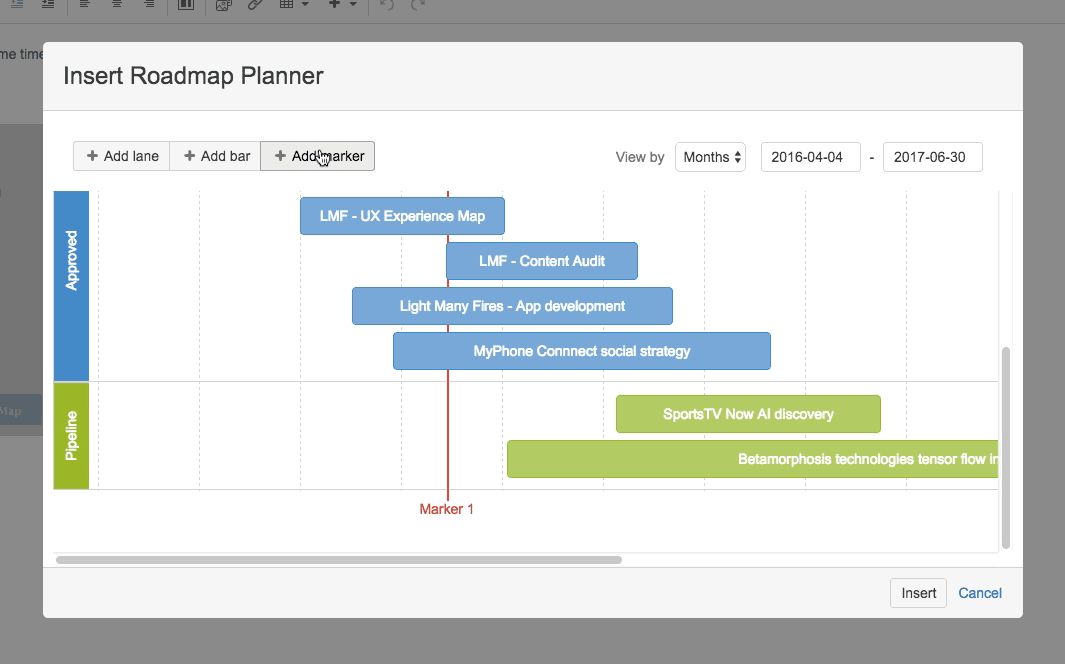
Looking great! Now let’s add in some markers for key milestones and dates. Go back into edit mode for the macro, click on ‘add marker’, add as many as you need. Drag the markers to the appropriate place in the timeline, give them a name and save the page.
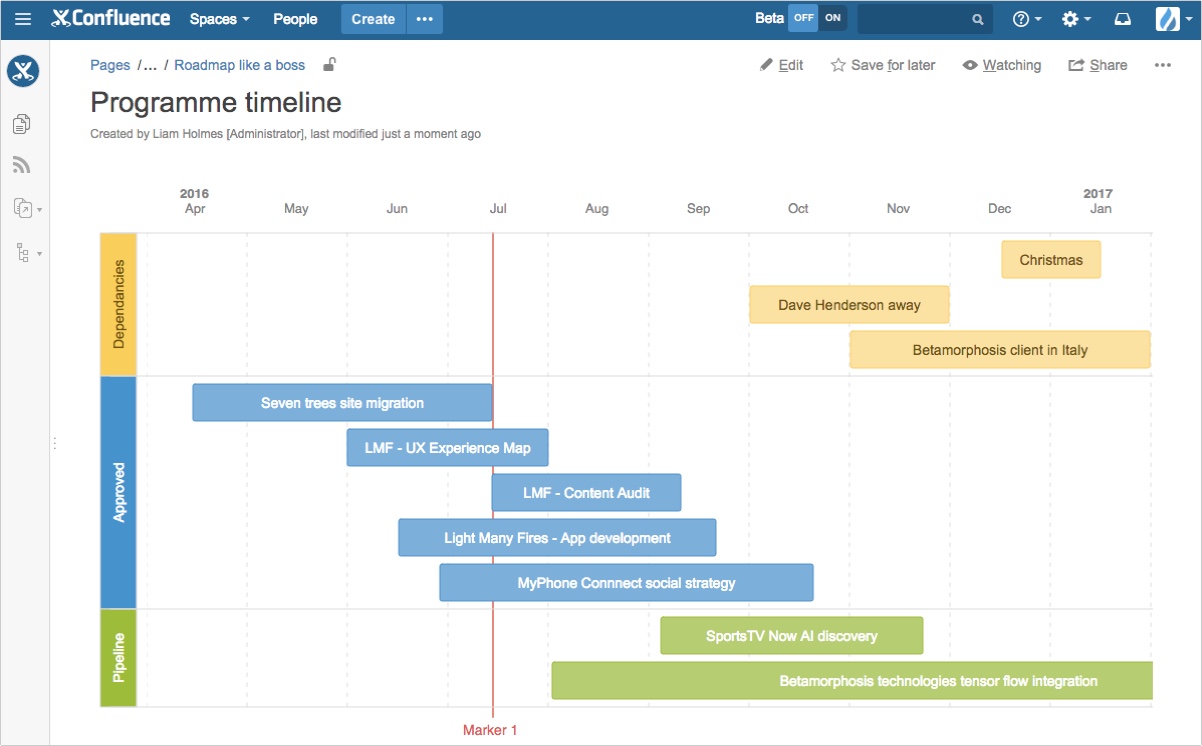
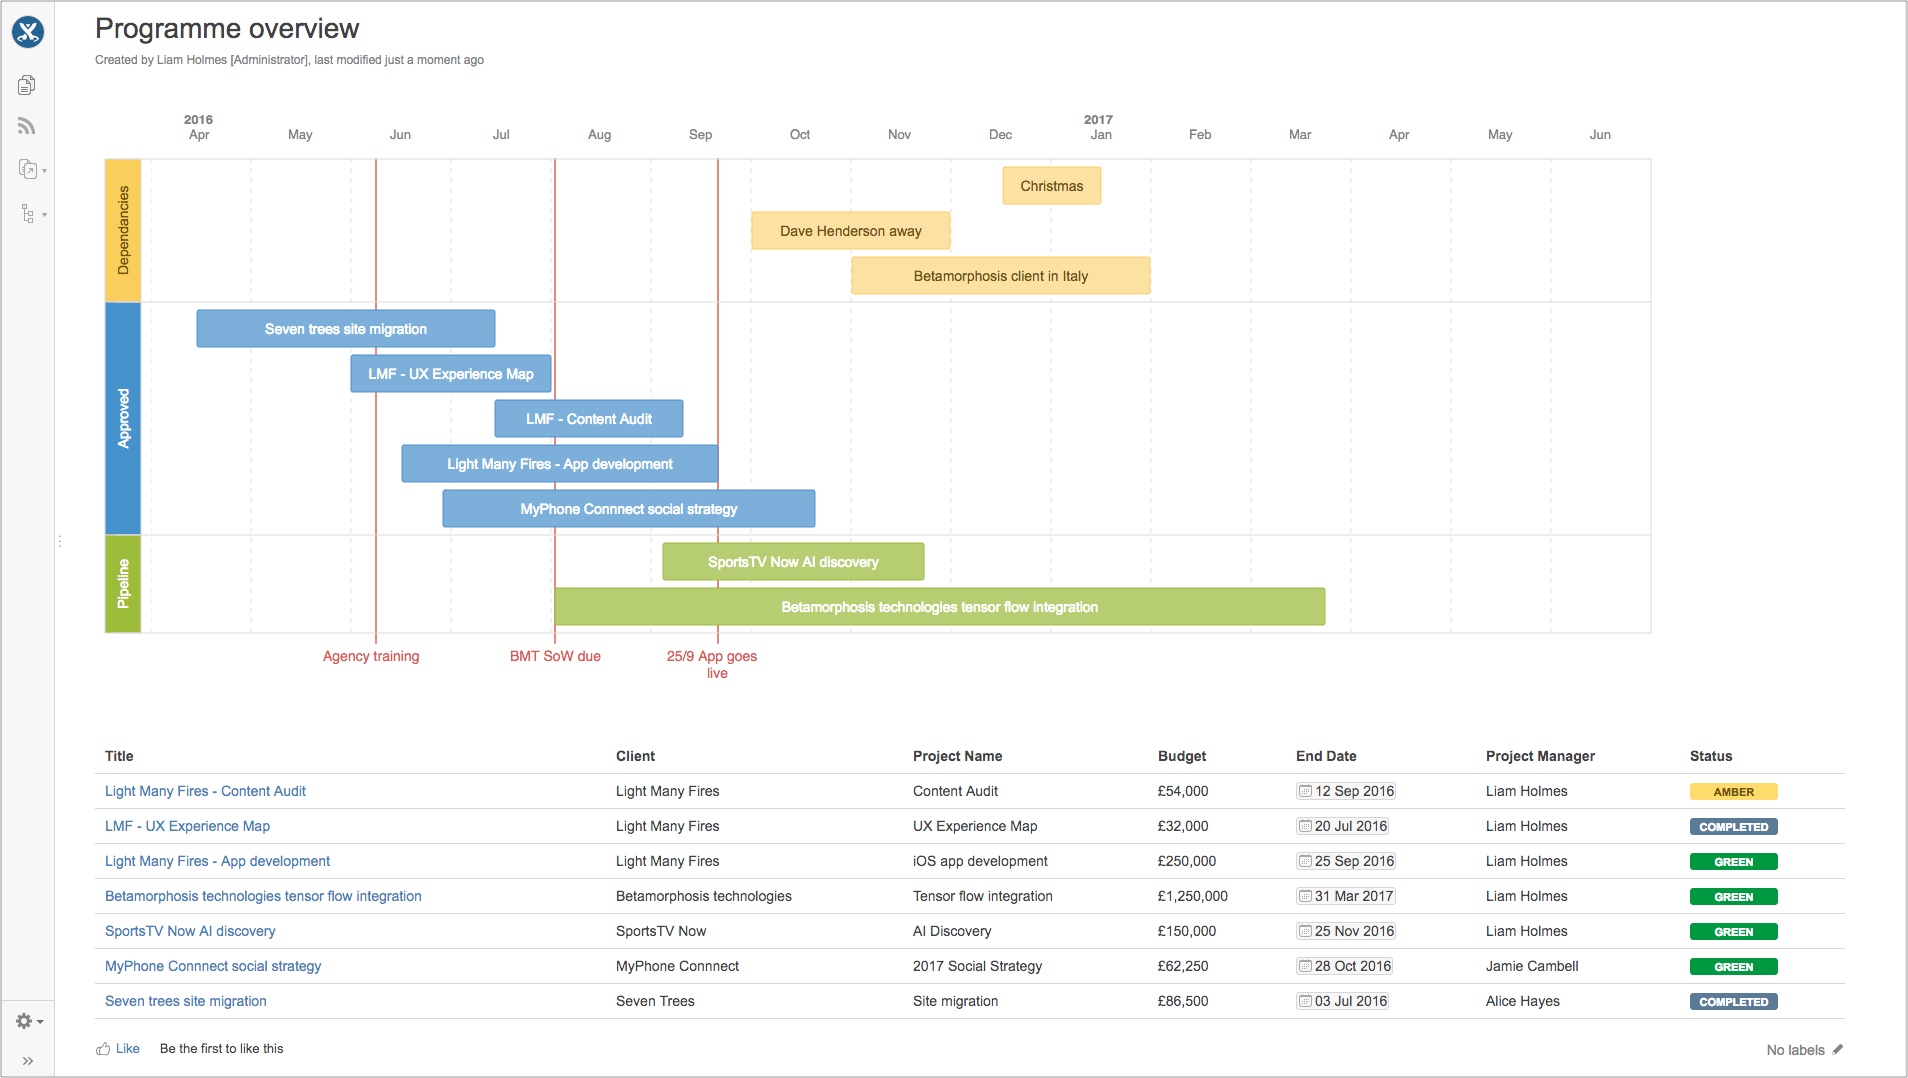
And now we have it, an awesome looking programme roadmap that gives visibility to both yourself and your team! Furthermore, your team can quickly dive into the project documentation from the pop over as seen below. No more emails from your team asking you to shoot them the link to the project 🙂
Boss tip!
Add the programme timeline page above or below your programme summary page to give you and the team the complete programme overview.
I’ll detail how this is achieved in the next post.
I hope you found this post useful, please leave your thoughts and comments in the comments section below.
View Comments (12)
Great article, thank you!
No worries! I hope you'll find it useful.
Is there any possibility how to add bar which will represent current day and will be updated as time flies?
Hi Ondrej, unfortunately, there is no indicator to mark today's date, nor any marker that will automatically update over time. The workaround that I have used in the past is to create a marker and update the position of that marker each week.
Hi Liam,
Is there a way to display roadmap with daily view?
Thank you
Hi Dritan, thank you for the comment. Unfortunately, there is no way create a 'daily view' with the roadmap macro. When I've had to plan out work on a daily basis I've used a simple table layout with the headers being the dates and cells below being the content/tasks relevant to that day. Not sure if that helps, but hopefully Atlassian will soon update the macro to account for a daily view.
Great article. Is there anyway to make the roadmap wider? I have a 3 month range and the bar titles are not shown because they are too narrow.
Hi Janek, thank you for the feedback! What I suggest trying is, whilst in edit mode of the Roadmap macro. Change your timeline view from "years" to "weeks". Hopefully that will give you a wider view of the Roadmap.
I have attached a screen shot below.
https://uploads.disquscdn.com/images/845816e634a7d2bd3e40335185898811e160e6801783d996533fe99ca07bb70e.png
I am trying to change "View by" to years but all that is listed is weeks and months. Was the above suggestion just a typo? Am very interested in displaying a longer term roadmap by years, not weeks or months. The drop-down only has weeks and months unless I'm missing something.
Have you discovered any way of exporting the raw data from the roadmap into Excel or CSV file? I love the visual aspect of it but some of my stakeholders would like the "raw data" to import into other tools like Tableau or just pivoting in Excel. Thanks!
Hi Shahrum, thank you for the comment! Unfortunately, I can't see a way to export the data out as a CSV or Excel format. The way that I have shared this roadmap with stakeholders who don't have access to Confluence is to simply take a screenshot or export as a PDF and share via your communication channel of choice. If your stakeholders wish to do further analysis on your roadmap using Excel etc...you may have to consider an alternative road mapping tool. Check out http://www.aha.io/ I personally haven't used it. However, it may have the feature set that you're after. Thanks!
Hi, Do you know if there is any way to have bars that are differently coloured within one swimlane?